4 minutes
Study finds ‘loyalty leaders’ have both stronger financial results and lower operating costs.
Sponsored by Member Loyalty Group
What is the financial impact of my credit union’s member experience program?
This is a common question among credit union executives, especially those considering investing in proactively managing the member experience.
Research done by Member Loyalty Group shows that offering a great experience can really pay off, both with stronger financial results and lower operating costs.
In fact, credit unions we defined in our study as “loyalty leaders” typically see a higher return on assets, net income per member, membership growth and checking account participation. They also see fewer charge-offs and lower operating expense ratios.
Let’s get into the details.
How the Research Was Done
To date, Member Loyalty Group has collected millions of surveys from the members of our more than 160 client credit unions nationwide. Our clients are continually capturing and analyzing member feedback from all channels in an effort to remove pain points and improve members’ overall experience. This includes email surveys, web intercepts, mobile in-app feedback, plus social media feedback and reviews.
What follows is a comparison of six key financial performance indicators of our client credit unions to the industry average (based on NCUA 5300 data for CUs over $100 million in assets). The statistics in the header for each financial indicator are based on client credit union and industry numbers for Q4 2021. Q4 2021 Relationship Net Promoter score data was also used to split clint client credit unions broken into three performance groups (top, middle or low loyalty performer), as shown in each graphic. (Note: Net Promoter Score®, Net Promoter® and NPS® are registered trademarks of Bain & Company, Inc., Fred Reichheld, and Satmetrix Systems, Inc.)
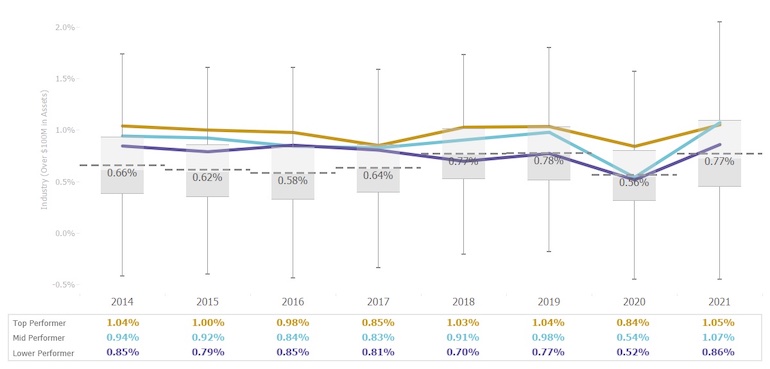
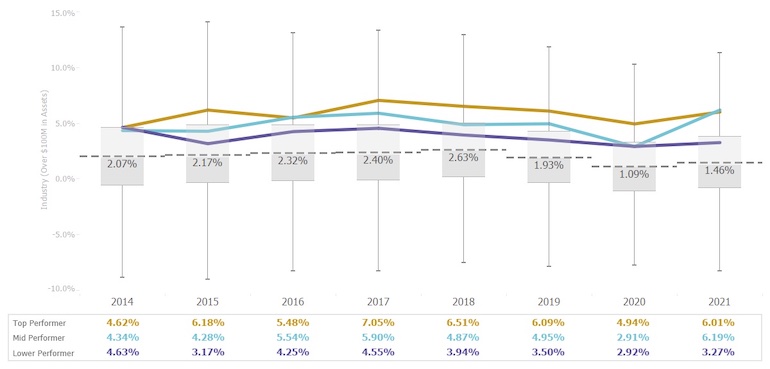
1. Loyalty Leaders Yield 22% Higher ROA Than Low Performers
The average return on assets for Member Loyalty Group’s client credit unions continues to match or outpace the industry average. The top performers consistently outpace the industry average.
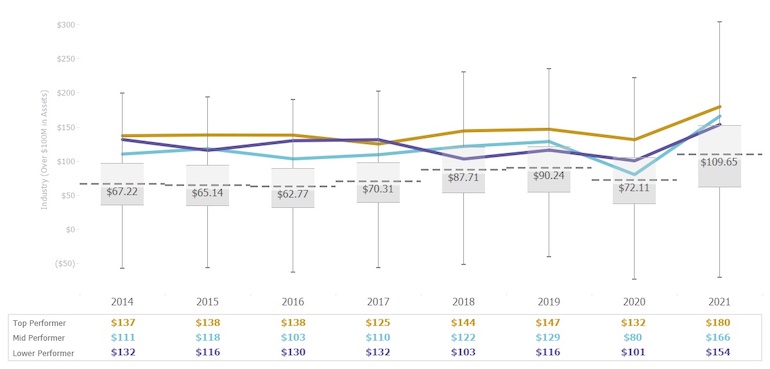
2. Loyalty Leaders Yield 17% Higher Net Income per Member
The link between NPS and financial performance is clear as you compare our clients’ data to the industry average. More, net income per member among loyalty leaders is a remarkable 98% higher than the industry average.
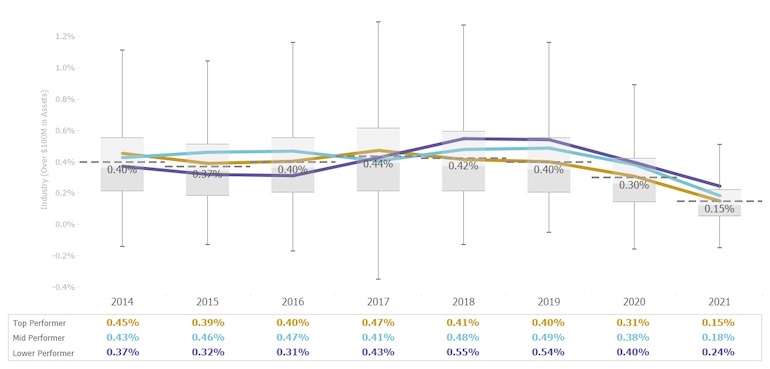
3. Loyalty Leaders Have 37% Fewer Charge-Offs
Member Loyalty Group credit unions often have similar or lower charge-off rates than the industry average, with top-performing credit unions having the lowest percentages.
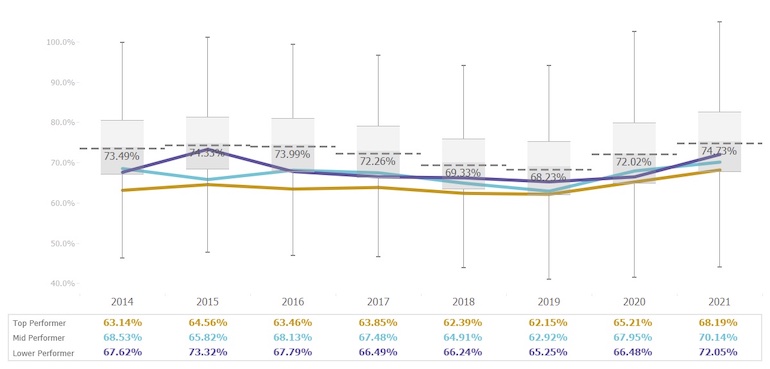
4. Loyalty Leaders Have a Lower Operating Expense Ratio
Loyalty leaders have a lower operating expense ratio than the industry average. The larger data set that we studied shows that they have some of the strongest productivity metrics and operate very efficiently. Additionally, they’re receiving more revenue from their engaged member relationships (e.g., other income is stronger for loyalty leaders). This allows them to keep the operating expense ratio low. This is notable as these credit unions have made a commitment and an investment in a member experience program.
5. Loyalty Leaders Experience 80%+ Higher Membership Growth
A key component of any Voice of the Member program is a recommendation from members. This positive word-of-mouth is clearly a factor, as top-performing credit unions’ membership growth rates were more than double the industry average.
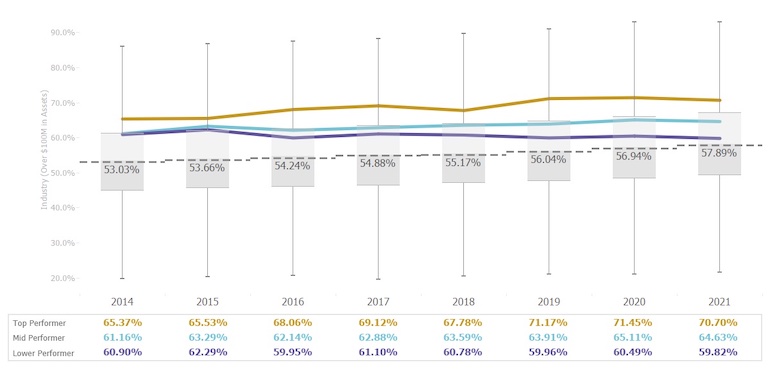
6. Loyalty Leaders Have Higher Checking Account Participation
Loyal members are more likely to obtain a checking account from their credit union. The chart below shows a distinct variance between Member Loyalty Group’s client credit unions and the industry average. This is an important sign of member engagement and primary financial institution status.
The trends we’ve observed year after year demonstrate that credit unions that focus on creating loyalty and deepening member relationships have enjoyed stronger financial and operational results. Looking more deeply at the full data set than what we can describe here shows that loyalty leaders’ financial success isn’t driven through higher fees, nor underwritten by increased operating expenses. It’s a function of increased member engagement.
Key takeaways:
- Loyalty leaders are seeing strong ROA
- Loyalty leaders experience strong net income per member.
- Loyalty leaders experience fewer delinquent loans and charge-offs.
- Loyalty leaders are controlling expenses very well.
- Loyalty leaders enjoy more active membership growth.
- Loyalty leaders have higher product participation and accounts per member.
We hope you find this data useful as you plan your own member experience initiatives.
Jake Foreman is the chief program officer at Member Loyalty Group. He oversees all programs offered by MLG, including the CU industry benchmarks that MLG publishes each quarter. Jake also leads the research and analytics team, which is responsible for deeper analytics, both of existing program data and new, competitive insights data geared to benefit the credit union industry. Member Loyalty Group is a credit union service organization created to empower credit unions to measure, manage, and take meaningful action on member feedback. Our platform is powered by Medallia, the leader in CX management. Serving more than 160 credit unions nationwide, we provide leading-edge technology plus the support of the MLG team and our partner credit union community.
Copyright © 2022 by Member Loyalty Group. No part of this publication may be reproduced, distributed, or transmitted in any form or by any means, without prior written permission.


