4 minutes
Profitability reporting best practices at BCU
As Vernon Hills, Ill.-based BCU grew, management recognized a need to make profitability analysis a focal point to optimize decision-making and drive strategy. Founded in 1981, $2.8 billion BCU now has 45 branches and more than 200,000 members. While assessing the credit union’s future needs, management evaluated its legacy profitability assessment system and found that the platform was a “black box” that used methodologies and calculations not visible to management. A more robust software solution that offered a higher level of control, supported flexible reporting and streamlined operations was required.
After a detailed vetting process, the credit union’s management team selected and implemented Kaufman Hall’s Axiom, Profitability Management and Funds Transfer Pricing solutions to meet their technology needs.
Deeper Analysis Made Possible by Efficiency and Automation
In addition to implementing the new software, BCU’s management shifted profitability analysis responsibilities to the finance team and added a performance analyst role (this author’s current position). These changes enabled the institution to improve two primary bottlenecks: manual report creation and an inability to distribute the reports in a timely manner. The new processes and systems addressed both of these areas.
For example, staff time required to complete monthly reports decreased from five days to one day. Report distribution to the credit union’s branches became automated, taking only 20 minutes to complete. These enhancements provide the finance team with more time to interpret results, and thus help turn profitability data into actionable insights.
Here are example analyses for branch and product profitability distributed by BCU’s finance team to assist management in making more informed decisions.
Branch Profitability Reporting
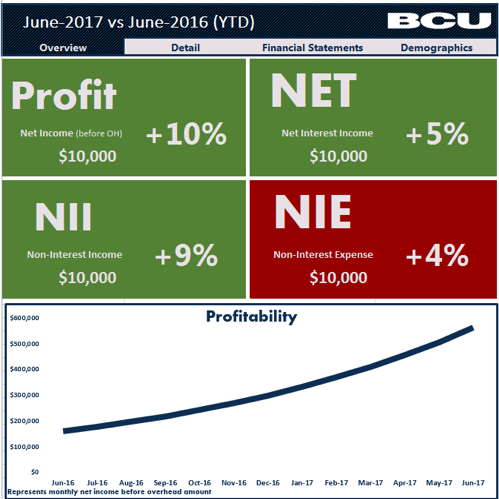
The BCU finance team creates and distributes monthly profitability reports for each branch manager. The reports track branch-specific key performance indicators, such as profit, net interest income, non-interest income and non-interest expense. The branch income statement (Figure 1) shows how KPIs are trending month to month. Once managers understand their KPIs, they can drill down to the branch income statement to review results in greater detail.
Figure 1. Sample BCU Branch Income Statement

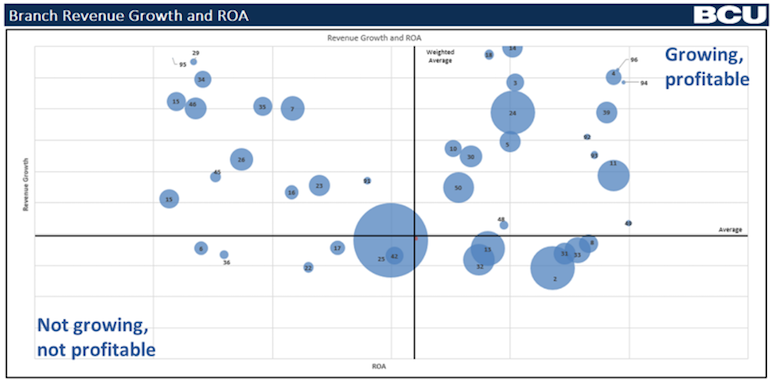
At BCU, the Axiom Funds Transfer Pricing solution supports tracking year-over-year revenue growth by branch. This level of analysis helps senior management understand branch value over time, adjusted for loan-to-share ratios, to support strategy and spending decisions.
Figure 2. Sample BCU Branch Profitability Report: Revenue Growth and Return on Assets

In the credit union’s branch revenue growth and return on assets report (Figure 2), each circle represents a branch, with circle size indicating asset size. Revenue includes interest income after FTP, plus non-interest income. Strong performers (upper right quadrant) have high revenue growth and a high ROA, driven, for example, by a growing loan portfolio. Branches in the lower left quadrant—neither growing nor profitable—require an action plan for performance improvement.
Product Profitability Reporting
Kaufman Hall’s Axiom software helps BCU’s management recognize the value that individual products contribute and conduct analyses by product category (e.g., reporting average profitability across mortgage loans).
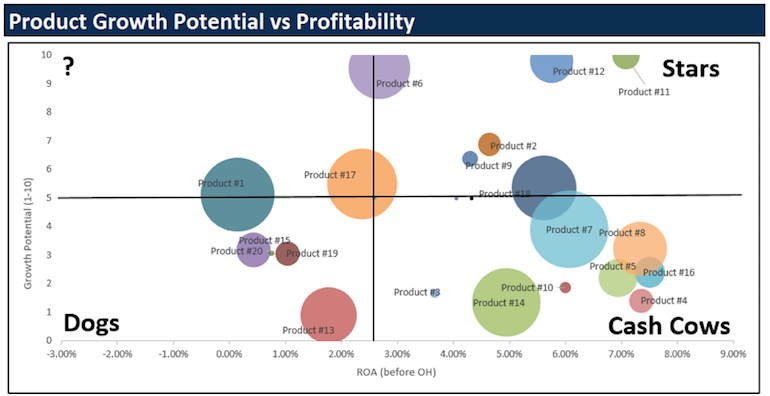
The finance team combines art and science, bringing together two dimensions to produce its product growth potential versus profitability report (Figure 3): the actual asset growth rates for each product (the “science”) along with product managers’ predictions regarding potential product growth (the “art”). Profitability is calculated as the actual ROA before overhead.
Figure 3. BCU Product Growth Potential vs. Profitability Report

“Stars” (upper right quadrant) are the clear product winners, with high profitability and high growth potential. “Cash cows” (lower right) may have slow growth but continue to add value. A product in the lower-left quadrant requires scrutiny—with low profitability and little perceived growth potential—but may be retained if it is complementary to a more profitable product. The upper-left quadrant also bears attention, reflecting fast-growing products with low profitability that may not warrant ongoing investment.
Looking Ahead
The BCU finance team continues to see benefits from these reporting activities. Making profitability analysis a focal point for the institution brings better understanding of profitability across channels. Building upon progress to date, the credit union’s leadership would like to evolve the reporting process into one that provides additional insight into the performance of individual products and categories in a continued effort to best serve members.
Jeff Truitt is performance analyst with $2.8 billion BCU, Vernon Hills, Ill.


